
PRODUCTS NAME
产品名称
detectability
检测能力
检测速度
检测精度
重复性精确度
GLOBAL PARTNER
全球合作伙伴
DEMO VIDEO
演示视频

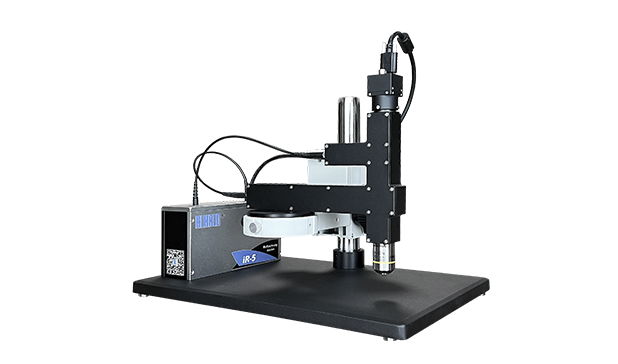
When we measure the reflectance of anti-reflection film on the lens, Traditional scheme can reduce the reflection of the substrate and the other side surface of the lens by frosting one side of lens to the black color. The process is tedious and will create operating errors.
IR-5 adopts a unique confocal scheme with a very short focal depth to support direct measurement of surface of the sample, free from reflected light from other objects to achieve non-contact and non-destructive testing.
Advanced general color difference △ E2000
CIE is more advanced in calculation of color aberration by the difference of the human eye sensitivity to color. More accurate simulation of subjective chromatic aberration of human eye can be obtained. As can be seen from the photo below, the human eye is most sensitive to orange color while least sensitive to cyan color .
* * * Note: The shorter the minor axis of the elliptical shape in the figure, the smaller the color tolerance.

The change in reflected color of samples under different ambient light
Samples show different colors under different ambient light, and iR-5 provides standard irradiation at different color temperature and calculates the chromaticity values at 2 ° and 10 ° from observer’s angle respectively. The objective and accurate measurement results can be used to guide the reproduction of color coating and anti-reflection coating technology, and provide color reports between standard sample and tested sample, or anti-reflection Film Report as per ISO Standard.
Optical fiber confocal mode to avoid interference of light
When measuring the reflectivity of the anti-reflection film of the lens, the traditional scheme can reduce the reflection of the substrate and the other side surface of the lens by frosting one side of lens to the black color. The process is tedious and will create operating errors. iR-5 adopts a unique confocal scheme with a very short focal depth to support direct measurement of surface of the sample, free from reflected light from other objects to achieve non-contact and non-destructive testing.
Comparison of tested sample and master sample
In below photo, white cross is standard sample while black cross is master sample


** CIE1931 Color Coordinate CIE1976 Color Coordinate
”S” in orange is master sample, ”T” in blue is tested sample

Reflectance curve for tested sample and master sample

Function:
Reflectance curve chart: Display reflectance curve (range :380 ~ 850 nm) . The wavelength can be customized within range
Chart Graduation Line: Display vertical and horizontal graduation lines
Quick Preview on Reflectance :The vertical graduation line can display corresponding reflectance of current wavelength
Reflection color contrast:The color difference can be calculated by comparing real-time data with those from master sample
Sampling interval: Calculation of pv, pm at 1nm or 5nm wavelength interval
Sample Information: Input of sample testing company and sample information
Reflection colorimetric report: Reflection colorimetric report output showing chromatic aberration, color coordinate
Reflection report: report and reflectance curve as per ISO and GB testing standard
Data save:Support file archived in TXT and Excel
Color calculation: Human visual parallax E2000, chromatic aberration ΔE, ΔH, ΔC and LAB coordinate ,CIE XY difference
ISO standard light source calculation: A D65 C D50a D55 D75 ID65 ID50 light source calculation
ISO observer's angle: 2 ° and 10 ° calculations
Reflectance display: Integral reflectance pv, average reflectance pm, reflectance at single wavelength pλ
Computer configuration:Windows 10/11
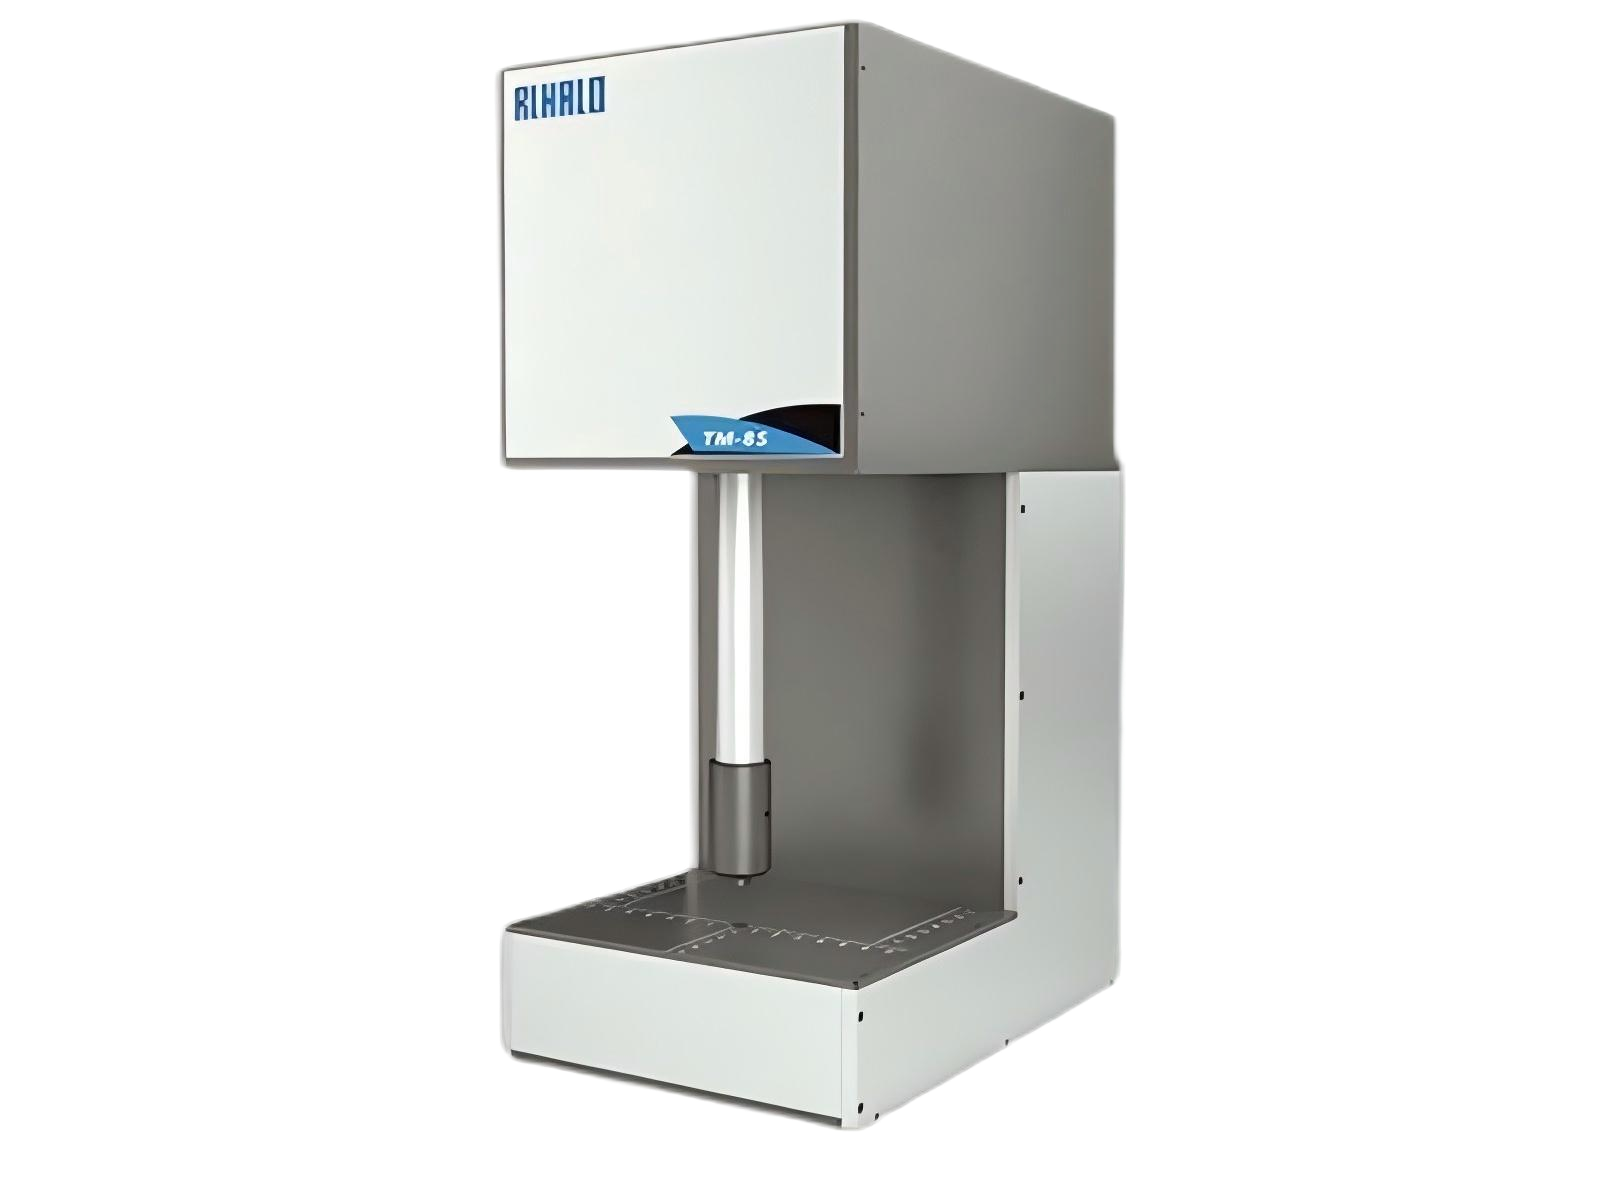
Lens Transmittance
TM-8S
DETAILS >
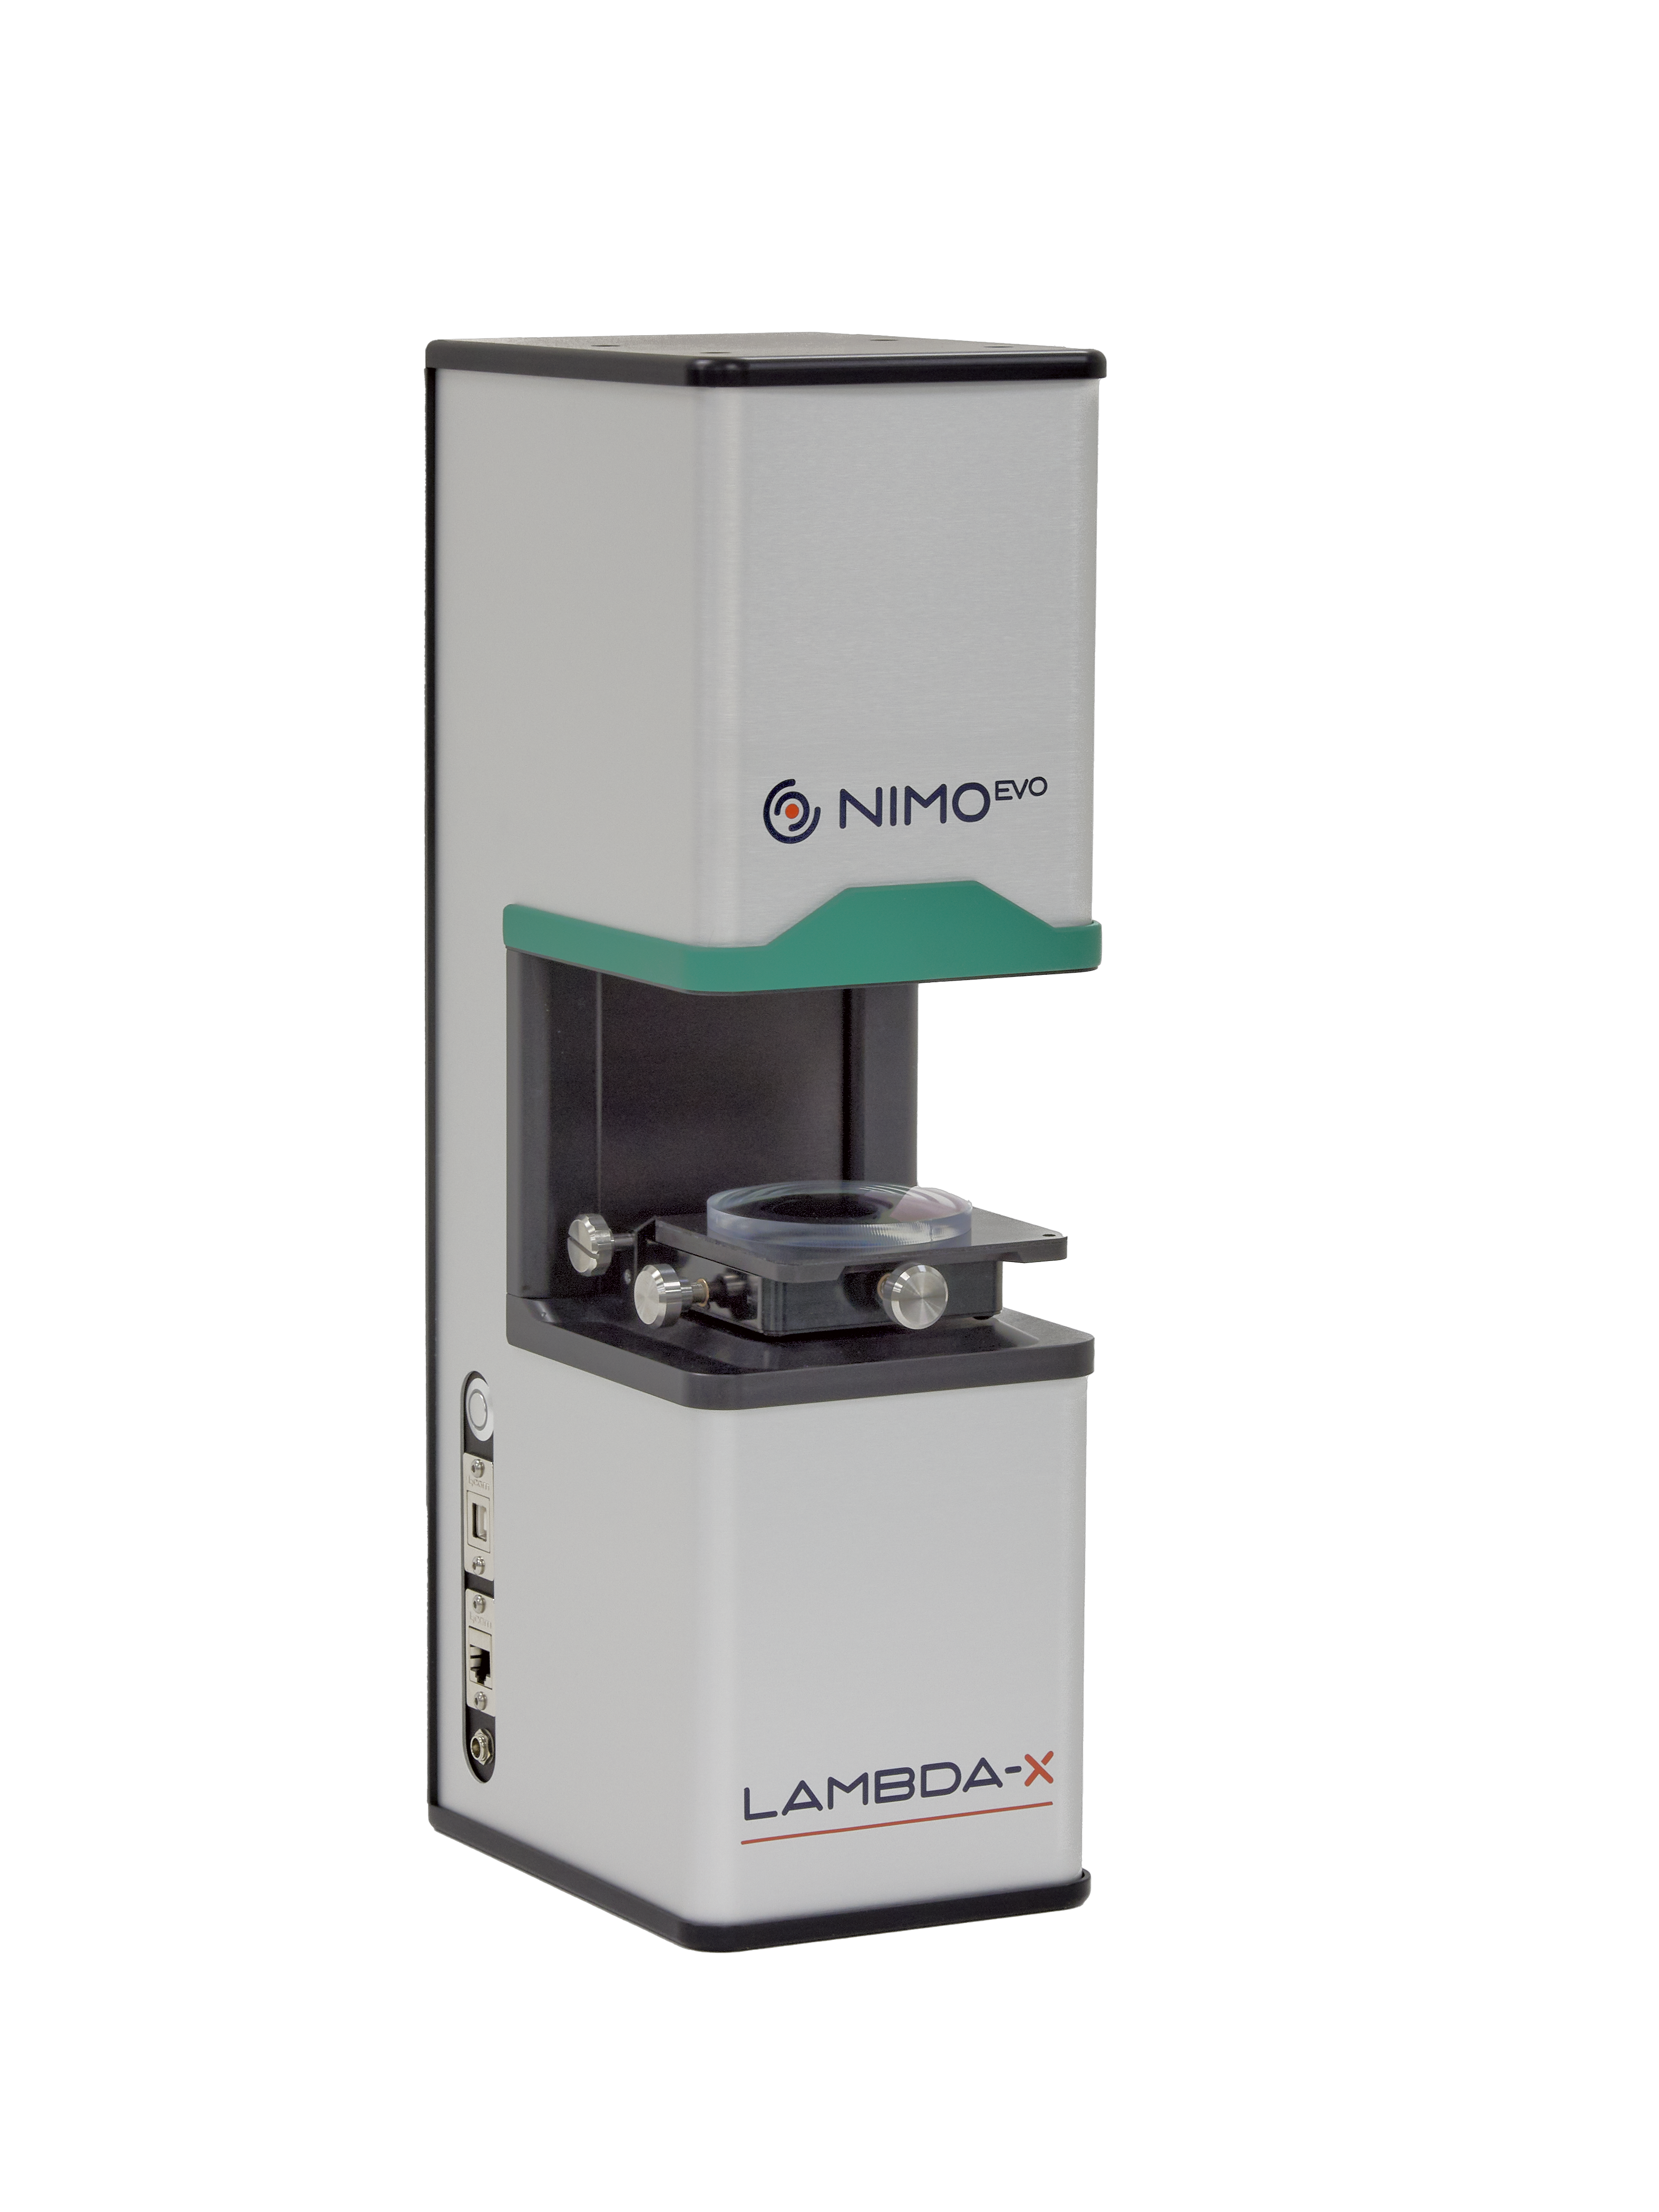
Micro Lens Measurement
NIMOevo SPL
DETAILS >
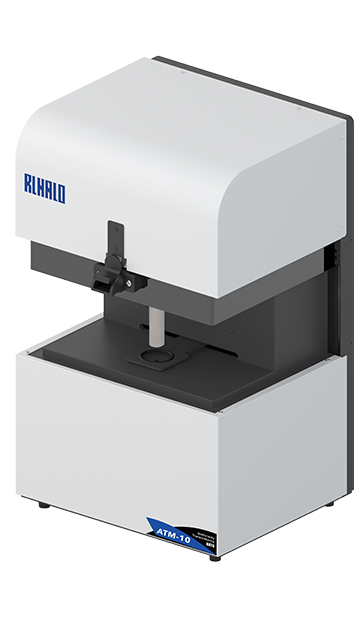
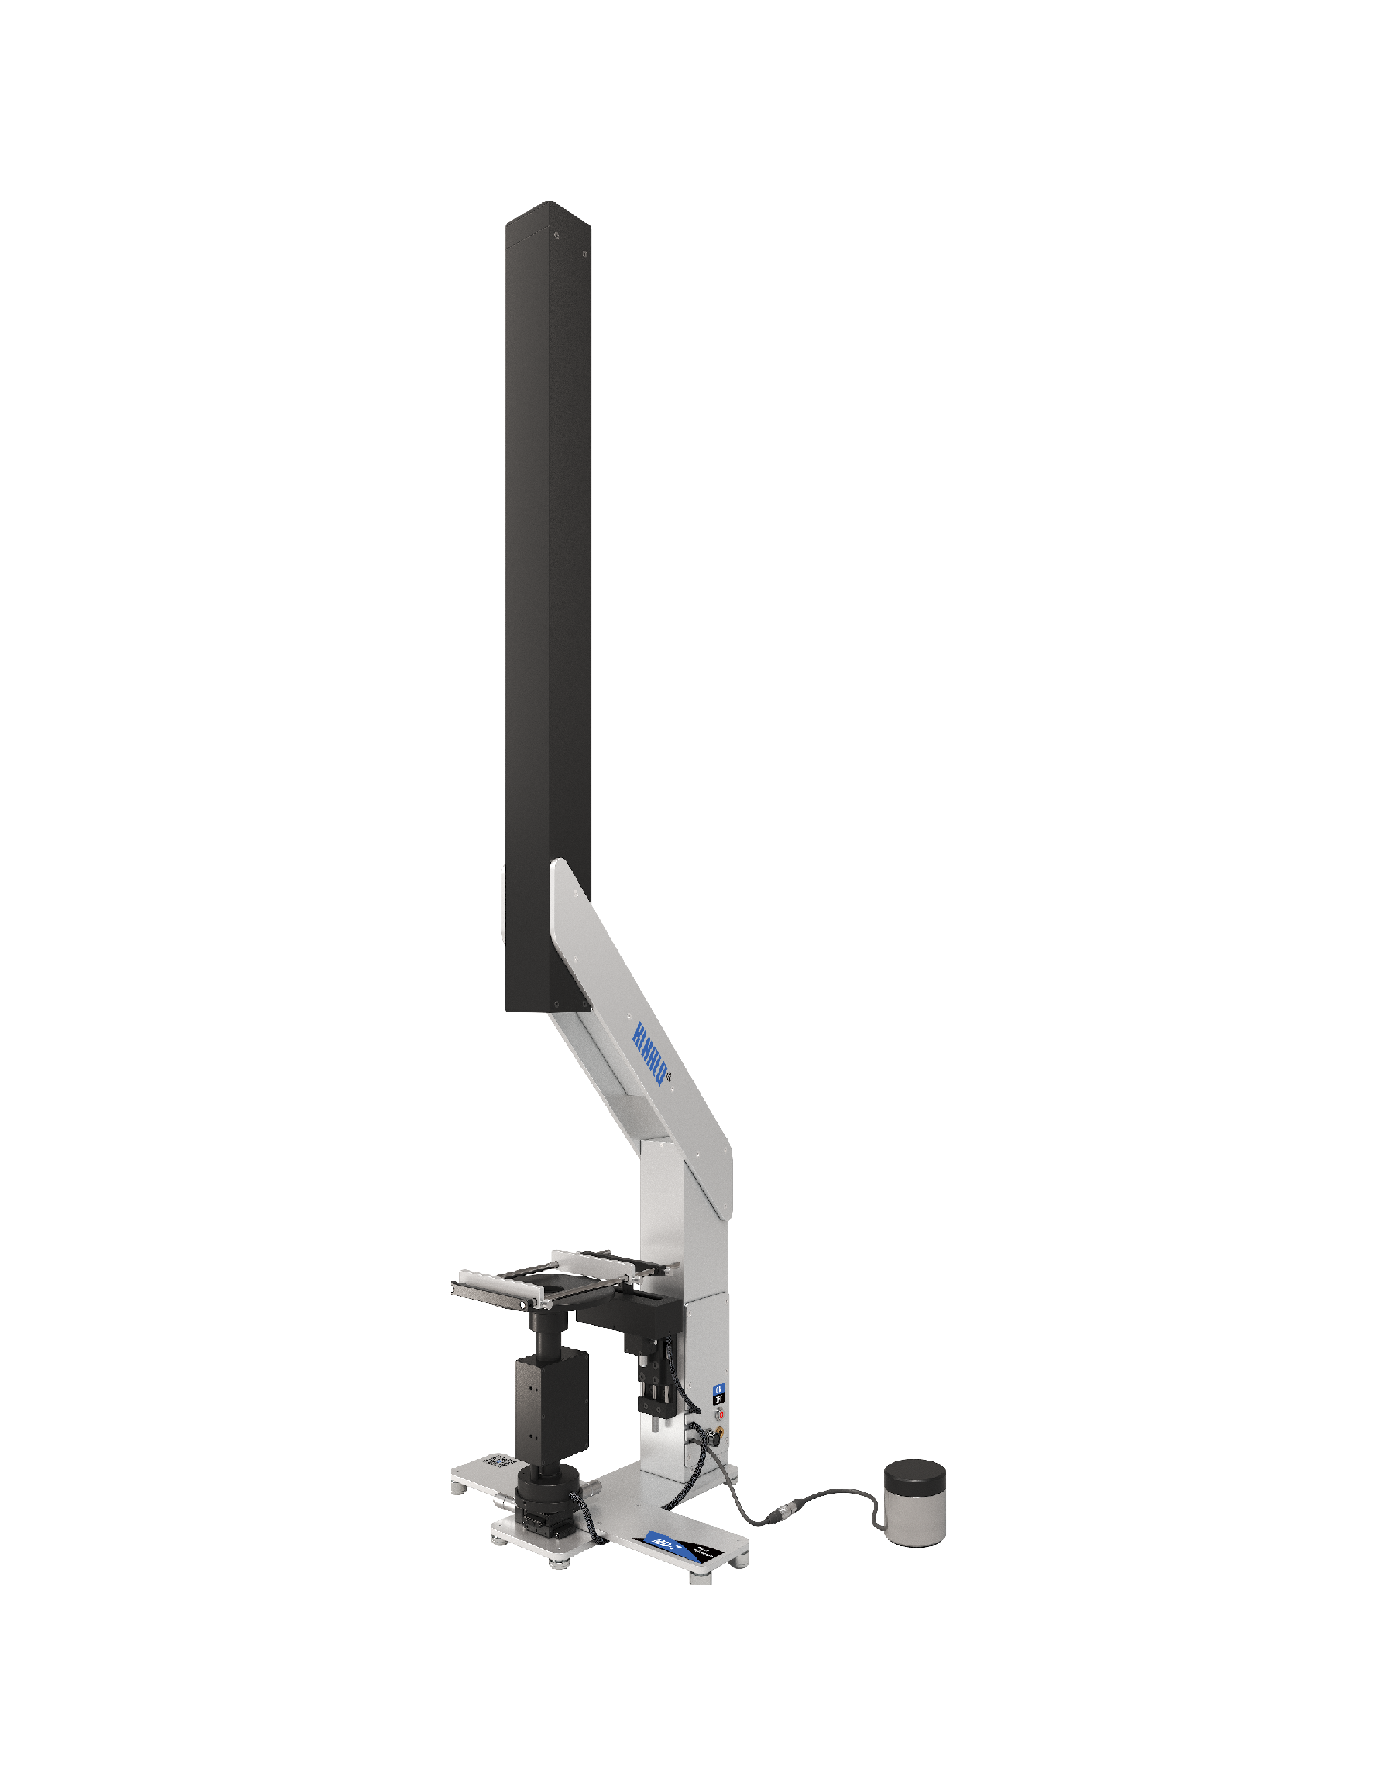
Transmittance Uniformity
ATM-10
DETAILS >
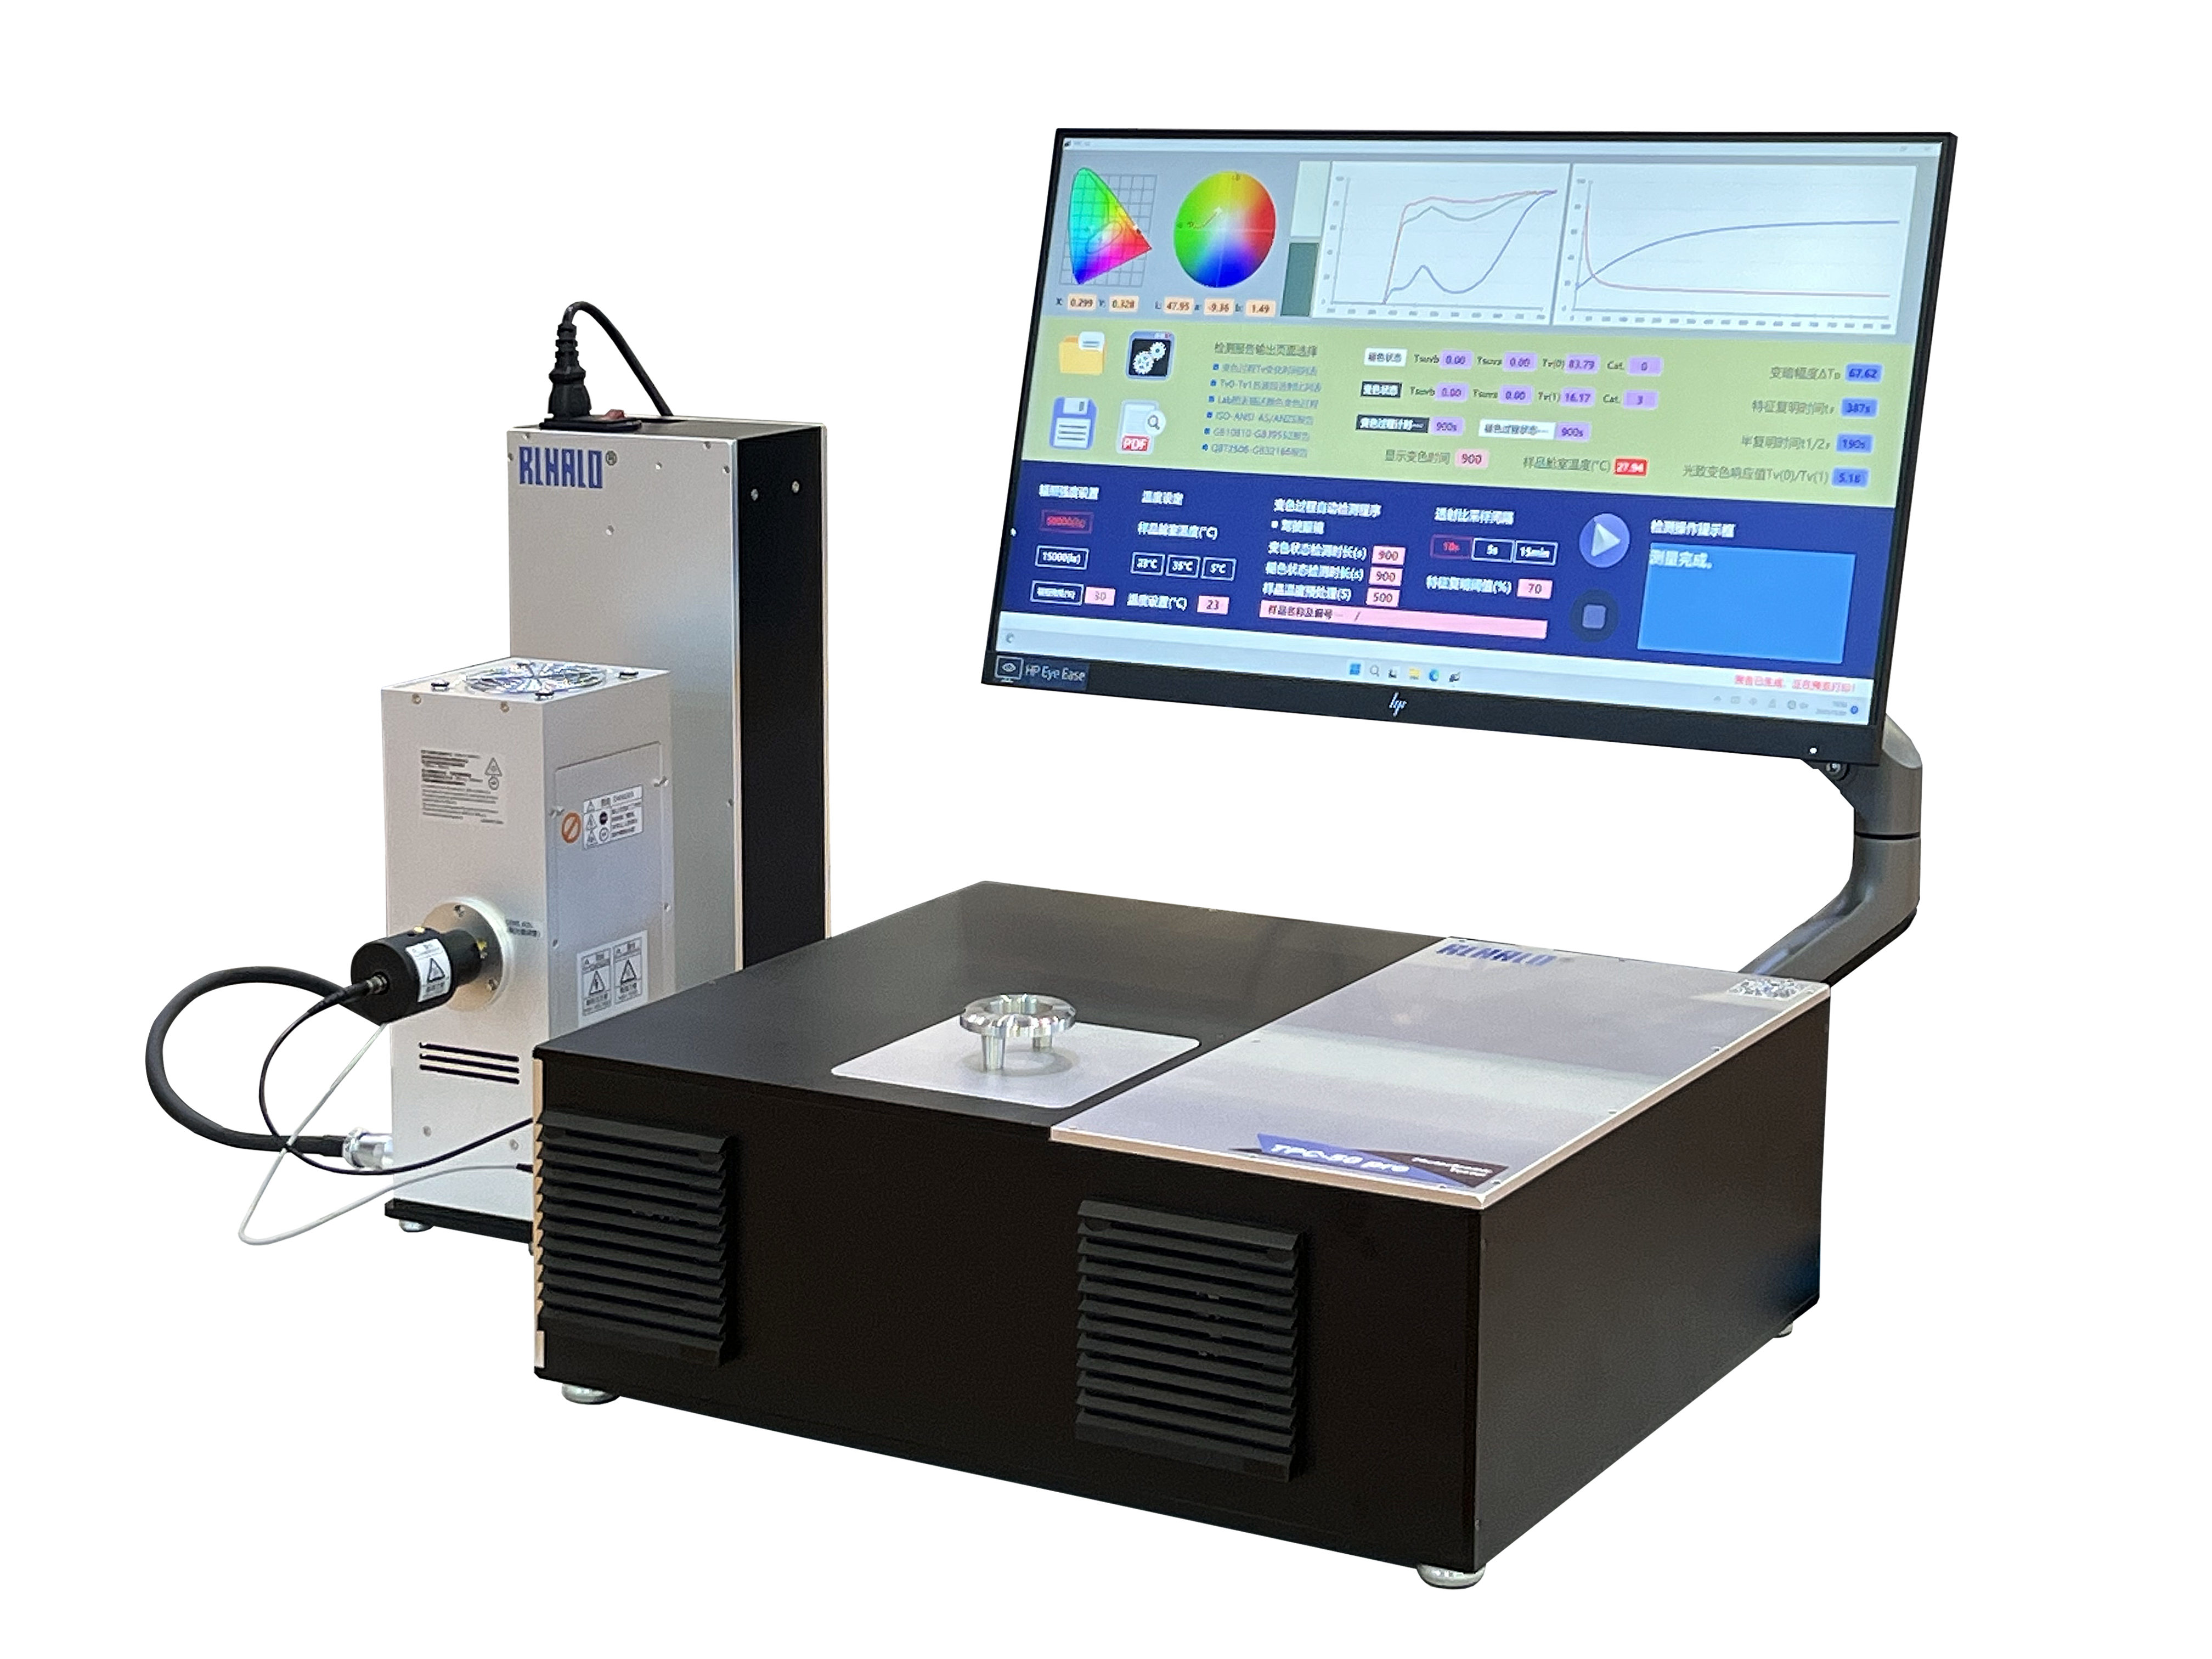
Photochromic Lens Test
TPC-50
DETAILS >
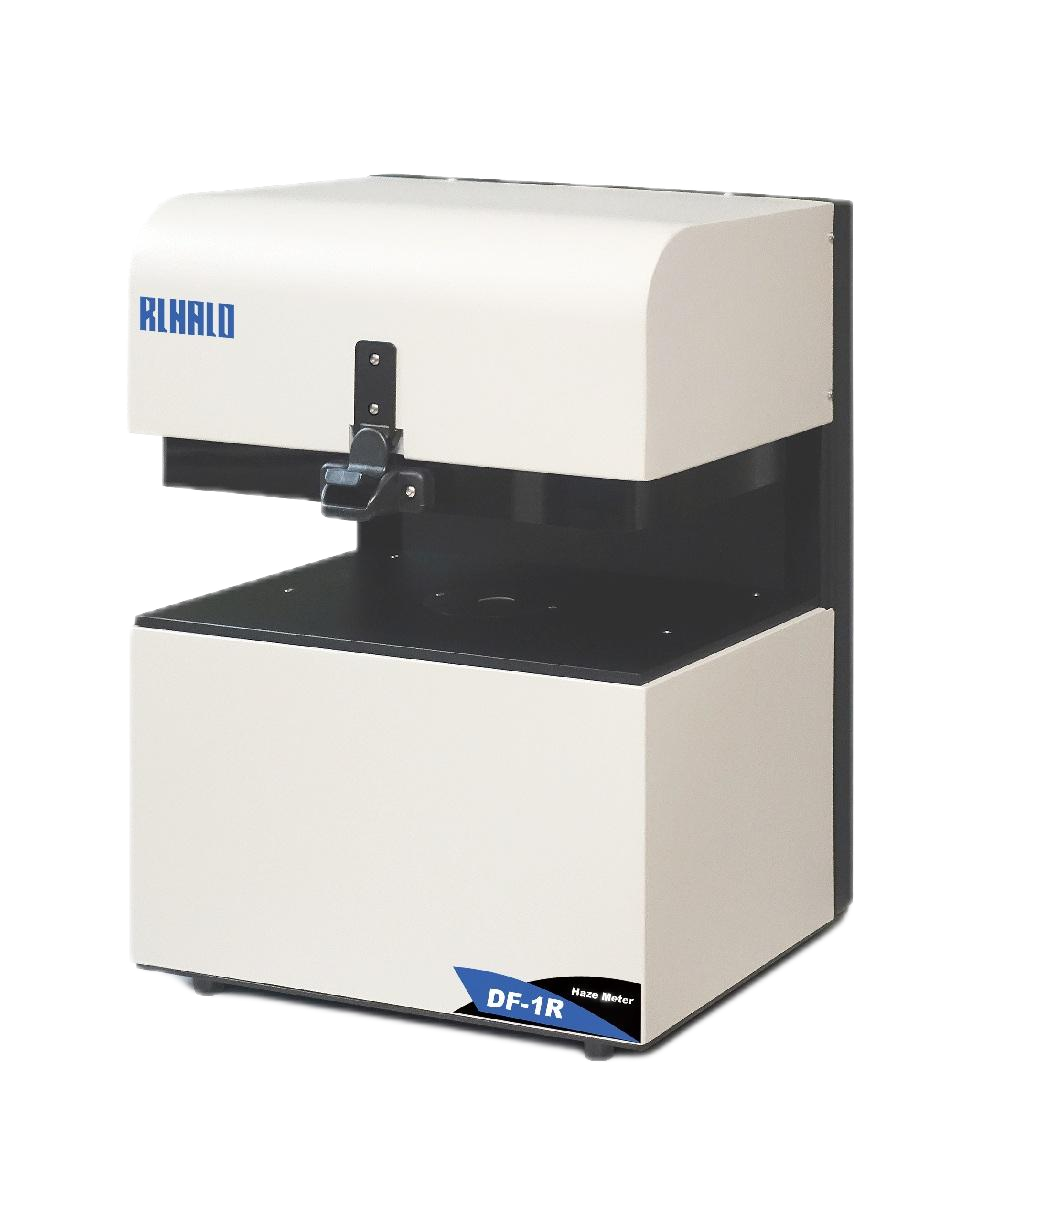
Hazemeter
DF-1/1R
DETAILS >
Telescope
MD-7
DETAILS >
Polarization Tester
AP-5
DETAILS >
Refractive Power
RPD-1
DETAILS >
Anti-Fog Capability
AFG-2
DETAILS >
Color Difference Test
Spectrum
DETAILS >
(第一步)
测样流程

(第二步)
在寄送样品前请填写下面的表格
样品检测类型
您的公司*
您的姓名
您的电话*
哪些检测项目对您很重要?
您想用哪款设备检测样品?
验证码*